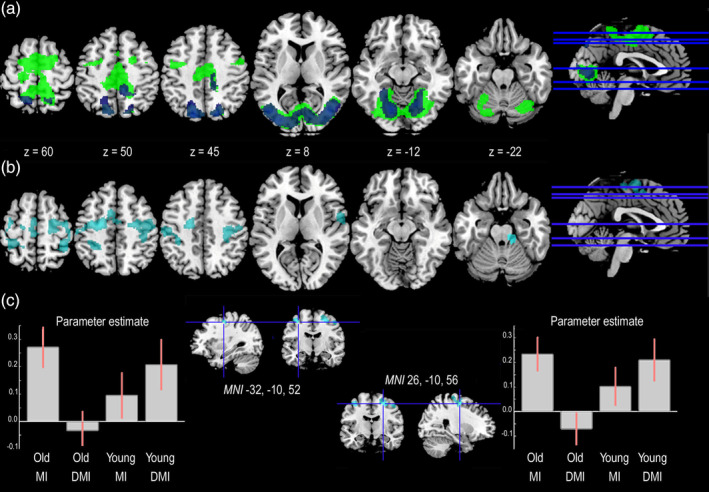
Figure 3.

The conjunction and interaction effects in the Virtual Walking analysis. (a) The areas commonly activated by younger and older participants during MI (green) and DMI (blue) as shown by the results of the Virtual Walking analysis. (b) The areas showing an interaction effect in the Virtual Walking analysis. (c) The plots report the parameter estimate (beta values) for the two clusters included in the interaction effect that also showed a significant effect of group in DMI (in this figure, we used the simple group effect of DMI [DMI_Young > DMI_Old contrast] as an explicit mask). Only activations surviving FWER‐correction for multiple comparisons at either the cluster or voxel level have been reported [Color figure can be viewed at http://wileyonlinelibrary.com]
