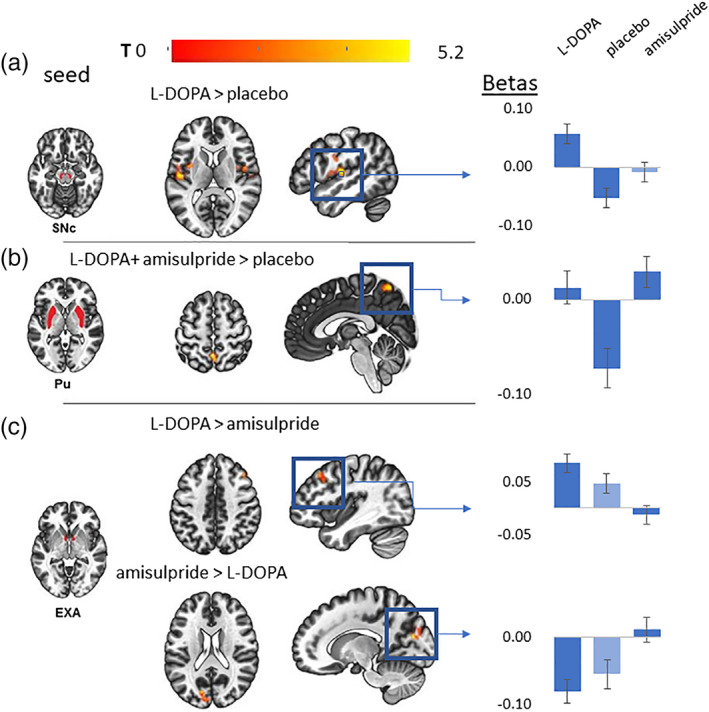
Figure 1.

(a–c) Connectivity changes from selected seed ROIs during different drug conditions. The left column shows in A, B, and C the seed region masks from the substantia nigra (SNc), the putamen (Pu) and the extended amygdala (EXA). The axial and sagittal slices show the most significant cluster for the specified and its location. The color coding bar depicts the voxel‐wise T values. The column with bar plots on the right shows the mean beta values extracted from the respective cluster for all drug conditions. Conditions that were not explicitly included in the contrast are filled with lighter blue and are shown to illustrate linear effects. The specific contrast image on the left is linked via a blue arrow to its corresponding barplots on the right
