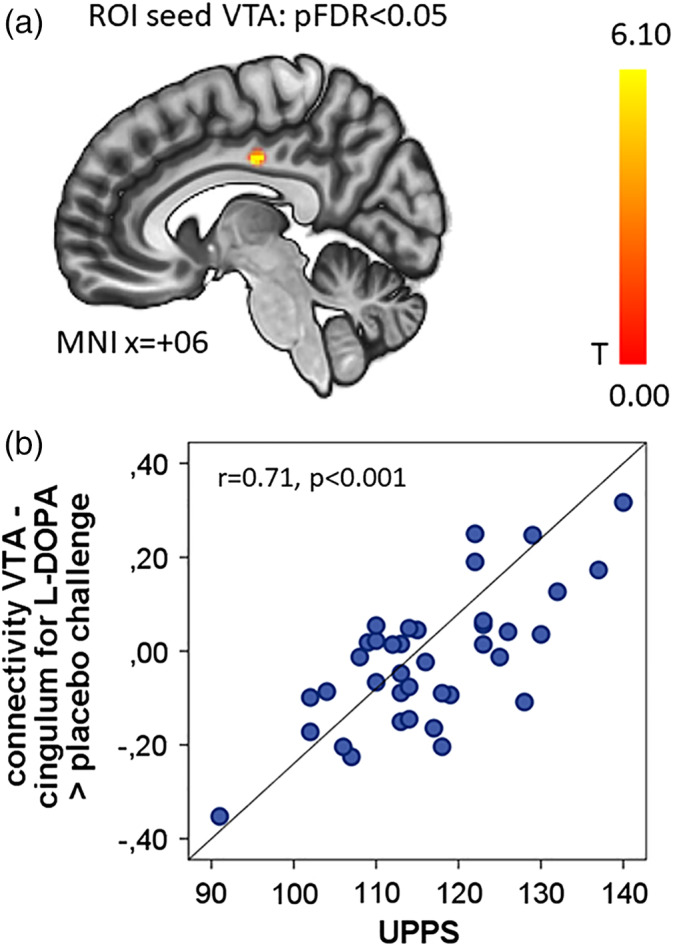
Figure 2.

Impulsivity modulates VTA‐mid‐cingulum connectivity for l‐DOPA > placebo. (a) Sagittal view of the significant cluster (MNI coordinates +06, −16, −36) correlated with UPPS impulsivity sum score from the seed VTA for l‐DOPA > placebo. Color bar gives T values. (b) Scatterplot with the extracted mean correlation from the cluster specified above and UPSS impulsivity. The correlation coefficient r is shown with a uncorrected p value calculated from the mean extracted beta value
