
Figure 2.
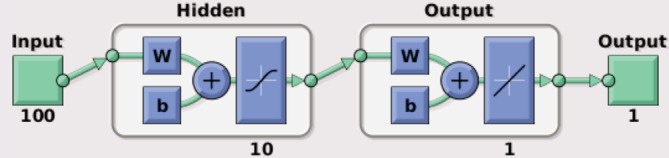
Schematic of output from the feed‐forward NN employed in this study, from the view command in MATLAB. In this example, the input consisted of 100 rs‐fMRI‐derived features connected to one hidden layer with 10 neurons; however, the hidden layer size varied with task according to the hyperparameter optimization. The hidden layer was, in turn, connected to the output layer, resulting in one predicted activation value for each grayordinate. W represents the weights of the connections between layers and b is the bias term