
Figure 7.
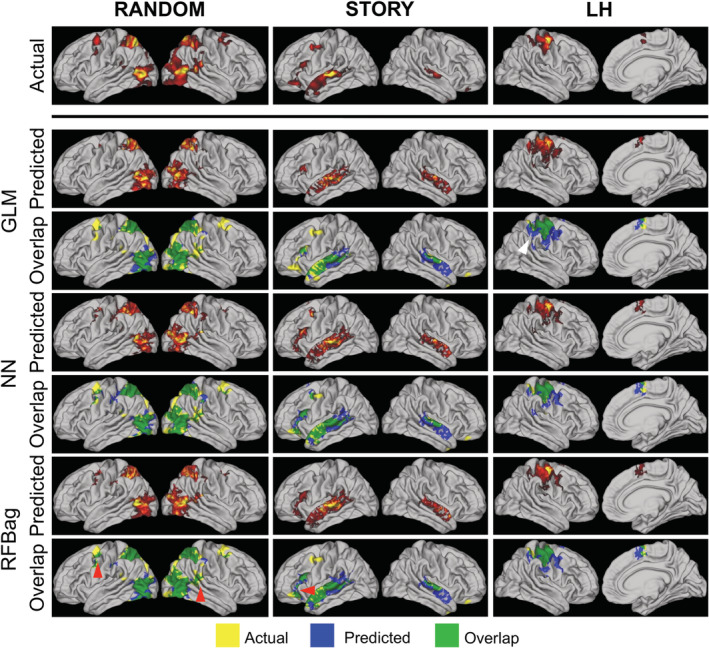
Example actual (top), predicted (middle), and overlap (bottom) maps for the GLM, NN, and RFBag models for the RANDOM (left), STORY (middle), and LH (right) tasks for one representative subject. Only positive activation is shown. Significant overlap is seen for all three approaches and tasks; however, additional overlap can be seen for the RFBag approaches as illustrated by the red arrows. For the LH case, the GLM model approach resulted in more spurious predicted activation compared to the NN and RFBag approaches (white arrow)