
Figure 2.
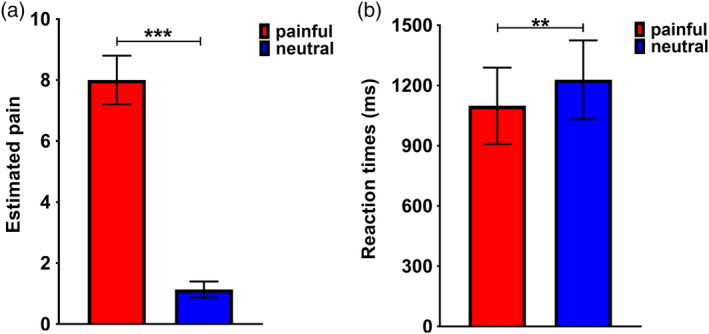
The behavioral data in the fMRI experiment. (a) Bar charts depicting mean estimated pain rating difference scores per condition for painful and neutral photographs. (b) Bar charts depicting mean reaction times per condition for participants rating painful and neutral photographs; Error bars depict SD (***p < .001, **p < .01, *p < .05)