Figure 2.

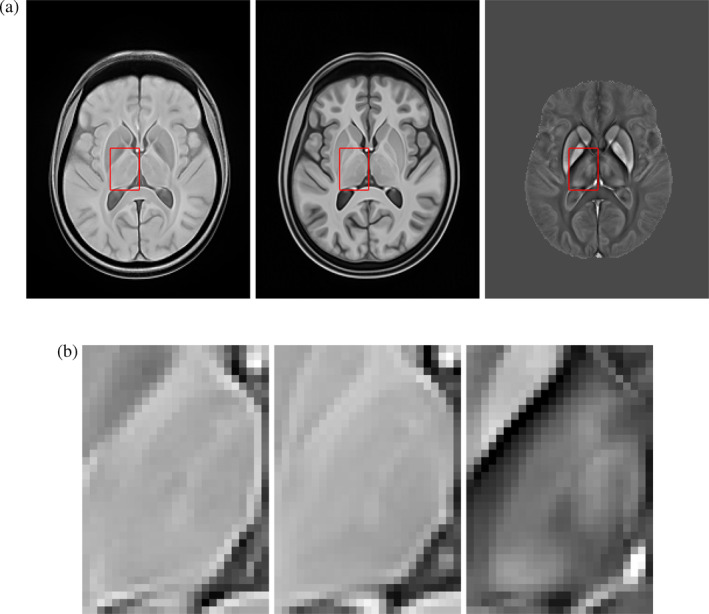
Anatomical detail from group‐average MRI templates. (a) Representative axial cuts (from left to right) of ‐, T 1‐weighted and QSM templates for the test dataset (Dataset II). (b) Magnified views of the left thalamus for the three templates

Anatomical detail from group‐average MRI templates. (a) Representative axial cuts (from left to right) of ‐, T 1‐weighted and QSM templates for the test dataset (Dataset II). (b) Magnified views of the left thalamus for the three templates