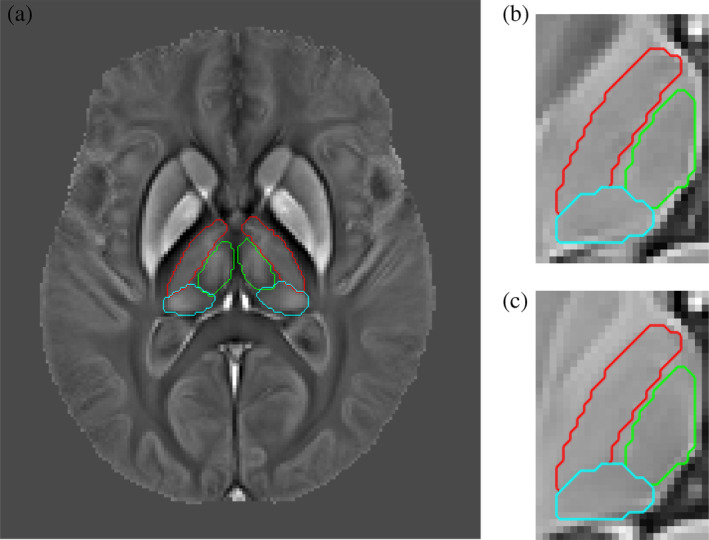
Figure 3.

Manual segmentation of three major thalamic subnuclear groups. Left: Bilateral contours overlaid onto the Dataset II QSM template. Red contours denote the lateral nuclear group, green contours correspond to the medial group, and cyan contours illustrate the posterior group segmentation. Right: Magnified view of the left thalamus showing manual contours overlaid onto ‐ and T 1‐weighted templates. (a) Manual contour overlays onto the N = 116 average QSM template. (b) ‐weighting (c) T 1‐weighting
