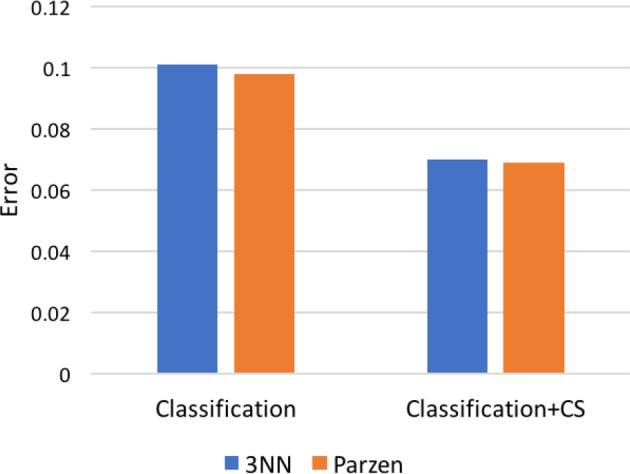
Figure 5.

Error rates for (left) classification and (right) classification followed by convex segmentation (CS) on Dataset II average template data. Bars represent misclassification frequency, that is, overall proportion of errors relative to the manually traced ground truth
