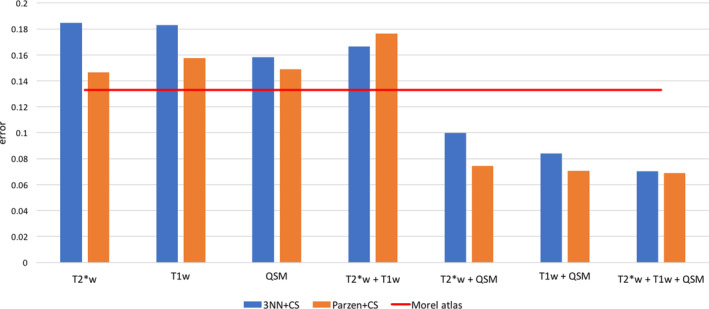
Figure 7.

Algorithm performance comparison as a function of input MRI data for Dataset II. The red line indicates the error rate for the Morel atlas segmentation. Classification errors were greatly reduced when combining QSM with other contrasts. The global minimum error was obtained using all three contrasts
