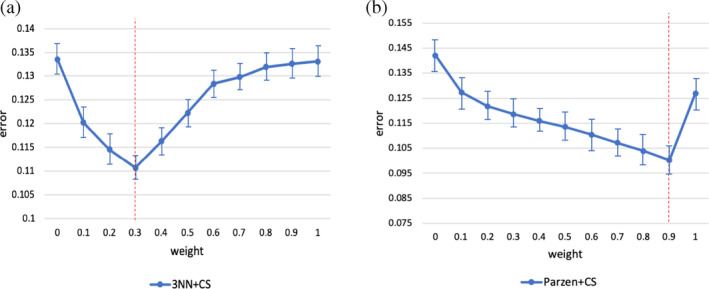
Figure 8.

Classification error (with respect to manual gold standard) as a function of w. Bars denote mean error (from average Dataset II template segmentation) for each possible combination of input data. Data points and error bars denote mean and SEM across N = 12 test datasets. The red lines indicate the empirical optima w (w = 0.4 for 3‐NN and w = 0.9 for Parzen)
