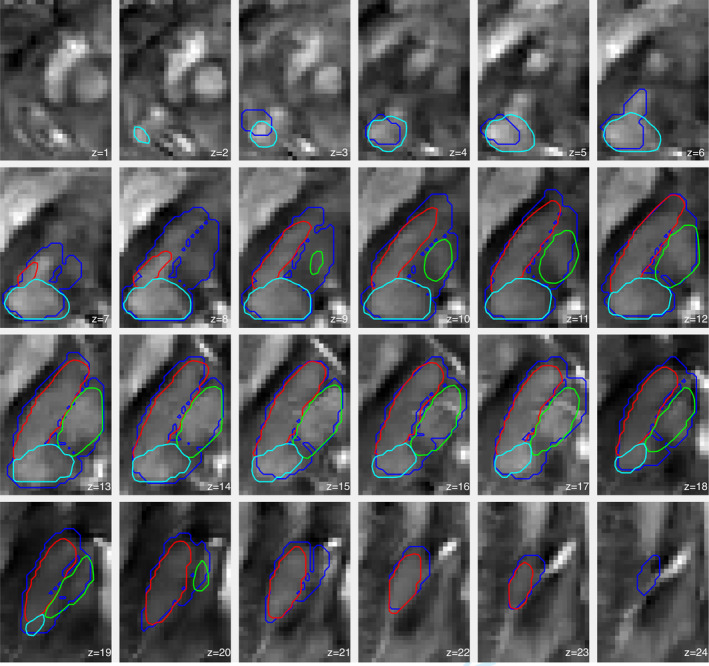
Figure 10.

Extended view (z‐slices) for single‐subject thalamus segmentation using 3‐NN based pre‐processing and w = 0.4. The blue overlay represents the ground truth's outer boundary. Red, green and cyan contours are the segmentation results for the three subnuclear groups. Contours are plotted onto the QSM contrast
