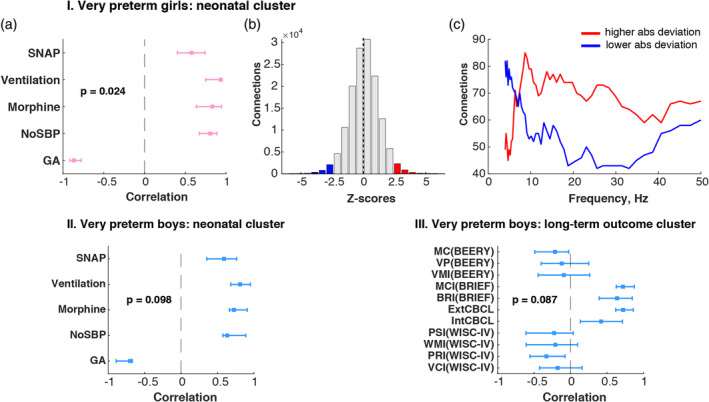
Figure 3.

Associations between absolute connectivity deviation and adverse neonatal experience and long‐term behavioral and cognitive outcome: the graphs I, II and III illustrate the results from three separate behavioral PLS analyses investigating correlations between the absolute deviation in connectivity from the same‐sex full‐term group I. in preterm girls and neonatal factors: (I, a) PLS correlation coefficients are shown as a tick mark with whiskers representing bootstrap upper and lower boundary for correlation coefficient for each neonatal factor; (I, b) overall z‐score distribution; (I, c) z‐score distribution across frequencies. (II) correlations between connectivity deviations in preterm boys and neonatal factors; (III) correlations between connectivity deviations in preterm boys and behavioral and cognitive outcome at school age. Neonatal cluster: GA—gestational age, NoSBP—number of skin‐breaking procedures, Morphine—cumulative morphine dose with dosing adjusted for weight, Ventilation—days on mechanical ventilation and SNAP—early illness severity. Long‐term outcome cluster: VC(WISC‐IV)—verbal comprehension, PRI(WISC‐IV)—perceptual reasoning index, WMI(WISC‐IV)—working memory index, PSI(WISC‐IV)—processing speed index from the Wechsler Intelligence Scale for Children; IntCBCL—internalizing index, ExtCBCL—internalizing index from the Child Behavior Checklist; BRI(BRIEF)—behavioral regulation index, MC(BRIEF)—metacognition index from the Behavior Rating Inventory of Executive Function; VMI(BEERY)—visual‐motor integration, VP(BEERY)—visual perception from the Beery‐Buktenica Developmental Test of Visual‐Motor Integration (5th ed.) [Color figure can be viewed at http://wileyonlinelibrary.com]
