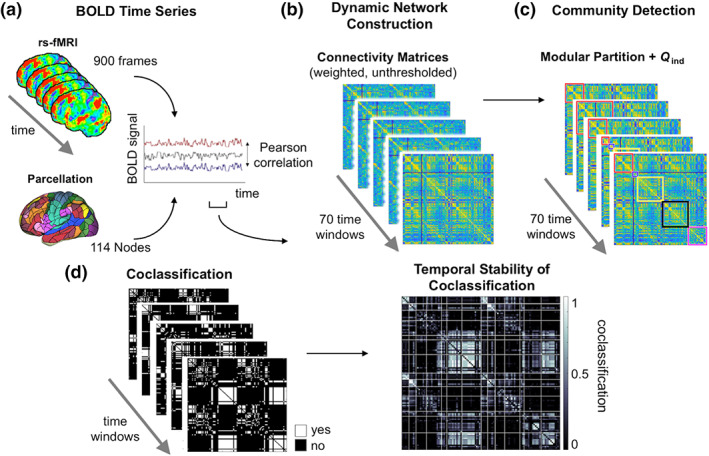
Figure 1.

Schematic illustration of analysis workflow. (a) Multiband fMRI data was acquired during resting state. Node parcellation is based on 114 subdivisions of the 17‐network Yeo atlas (see Section 2). Edges were modeled on the basis of Pearson's correlation coefficients between node‐specific BOLD time series for 70 time windows of 156 time points. (b) Weighted unthresholded connectivity matrices were computed for each time window. (c) Community detection was performed on each connectivity matrix. (d) Left: window‐specific coclassification matrices indicating whether a node pair is assigned to the same module (white) at a given time point. Right: connection‐specific stability values were calculated as proportion of time windows in which two nodes are coclassified to the same module. High values (white) indicate that the nodes of a pair are assigned consistently to the same module (exhibiting stable consistent module affiliation). Low values (black) indicate that a node pair is only rarely coclassified to the same module; rather, nodes stay consistently segregated from each other which may be interpreted as “stable absence” of segregation. Q ind, global modularity of individual‐specific module partitions. fMRI, functional MRI [Color figure can be viewed at wileyonlinelibrary.com]
