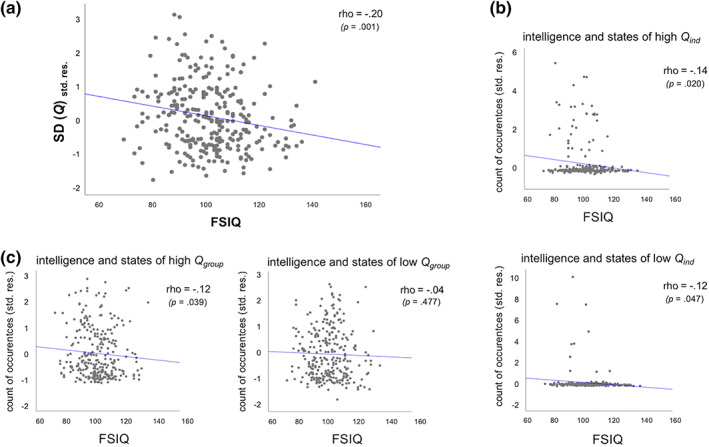
Figure 2.

Scatterplots for the associations between intelligence and functional brain network characteristics controlling for effects for age, sex, handedness, and mean framewise displacement (N = 281). (a) Association between intelligence (and the inverse of) brain network stability as indexed by fluctuations over time in global modularity. Variability in global modularity was operationalized as the SD of Q ind across time. (b) Association between intelligence and the number of subject‐specific high and low modularity states. States of high (upper row) and low (bottom row) modularity were operationalized relative to subject‐specific mean modularity (see Section 3 for more details). (c) Association between intelligence and the number of high (left) and low (right) modularity states defined in relation to the group‐averaged mean modularity. All illustrations represent partial correlations, with the y‐axis depicting the standardized residuals resulting from linear regression of age, sex, hand, and mean framewise displacement on the variable of interest, that is, SD(Q) or count of occurrences of modularity states. FSIQ, full scale intelligence quotient assessed with Wechsler Abbreviated Scale of Intelligence (WASI; Wechsler, 1999); p, p‐value of respective association indicating statistical significance if p < .05; rho, Spearman correlation coefficient; SD(Q), SD of global modularity from individual‐specific module partitions; std. res., standardized residuals [Color figure can be viewed at wileyonlinelibrary.com]
