
Figure 3.
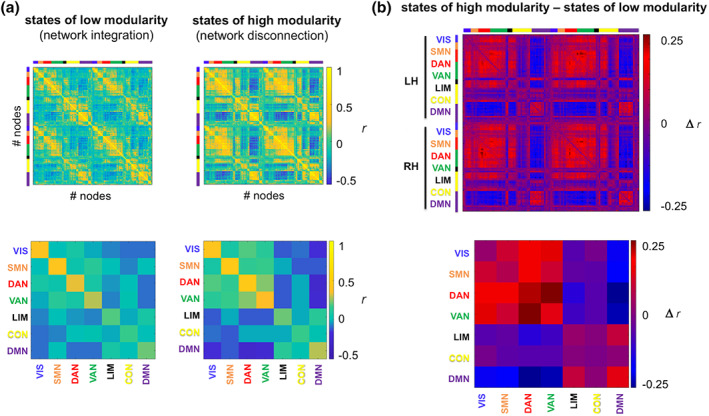
Extreme modularity states. (a) Group‐averaged functional connectivity profiles for states of particularly high or particularly low modularity. States were defined in relation to the across‐subject mean Q group and are based on a fixed resolution level of γ = 35. For illustration, each node was assigned to a standard seven‐network partition (see Section 2), as depicted in different colors along the axes. (b) Difference in group‐averaged functional connectivity profiles between states of high and low modularity. For illustration of network‐specific connectivity values (bottom row), nodal connectivity values were aggregated within and between the seven standard networks (integrated across both hemispheres, see Section 2). CON, control network; DAN, dorsal attention network; DMN, default‐mode network; LH, left hemisphere; LIM, limbic network; r, Pearson's correlation coefficient; RH, right hemisphere; SMN, somatomotor network; VAN, ventral attention network; VIS, visual network [Color figure can be viewed at wileyonlinelibrary.com]