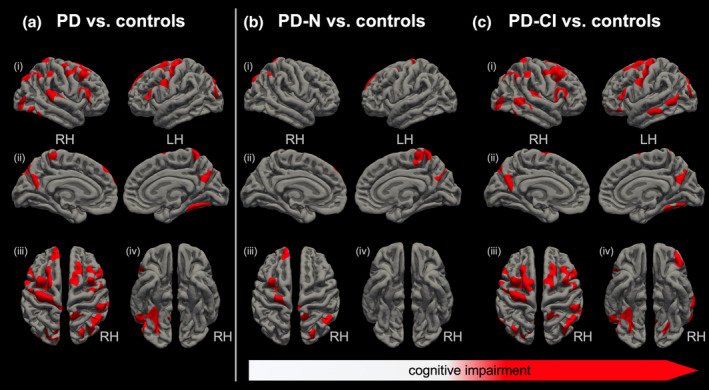
Figure 1.

Regional differences in cortical thickness at study entry: The whole brain‐based vertex‐wise analysis for (a) the overall study cohort and (b, c) in dependence of the cognitive status. Group comparisons are illustrated for healthy controls (n = 76) against (a) all PD patients (n = 136), (b) cognitively unimpaired PD patients (PD‐N, n = 57), and (c) cognitively impaired PD patients (PD‐CI, n = 79). All shown clusters are corrected for multiple comparisons using Monte Carlo simulation at a cluster‐wise threshold of p < .05. Results are projected on standard pial surface views from (i) lateral (ii) medial, (iii) dorsal, and (iv) ventral perspective. RH, right hemisphere; LH, left hemisphere
