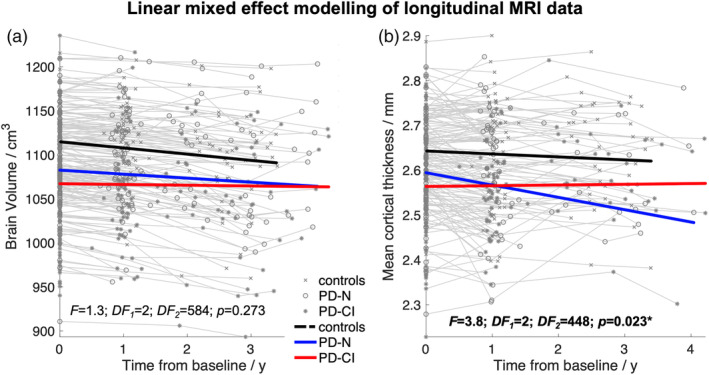
Figure 3.

Atrophy progression in PD patients depending on the cognitive status: Linear fits of the linear mixed effect (LME) modeled data for controls (black line), cognitively unimpaired PD patients (PD‐N), and cognitively impaired PD patients (PD‐CI). The cognitive status was based on neuropsychological assessment at baseline. (a) The LME model indicated no statistical difference in atrophy progression rate for the overall brain volume across groups (F = 1.3; p = .273). (b) LME fits indicated a weak but significant effect for mean cortical thickness across groups (F = 3.8; p = .023) due to the faster cortical thinning in PD‐N patients. (a, b) The LME fits are overlaid on the individual measurement trajectories (“spaghetti plot”). DF, degrees of freedom
