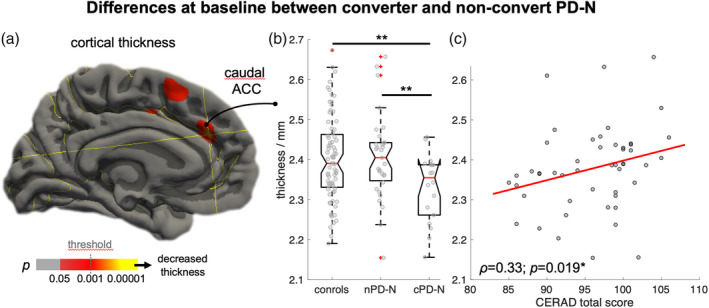
Figure 4.

Differences in PD converters at study entry. (a) Vertex‐wise analysis showing the difference in cognitively unimpaired PD (PD‐N) at study entry between those PD‐N individuals who maintained “stable” cognition (nPD‐N, n = 31) and individuals prior 1.4 years on average before “conversion” (cPD‐N, n = 18) to either MCI or dementia. Cortical thinning in cPD‐N compared to nPD‐N is shown in hot colors (p < .001). (b) Region‐of‐interest‐based comparison between averaged cortical thickness values for both hemispheres revealed significant thinning in the caudal anterior cingulate cortex (ACC) in cPD‐N individuals as compared to both nPD‐N (p = .009) and controls (p < .005). (c) Caudal ACC thickness in PD‐N individuals at study entry was significantly correlated with the CERAD total score (p = .019)
