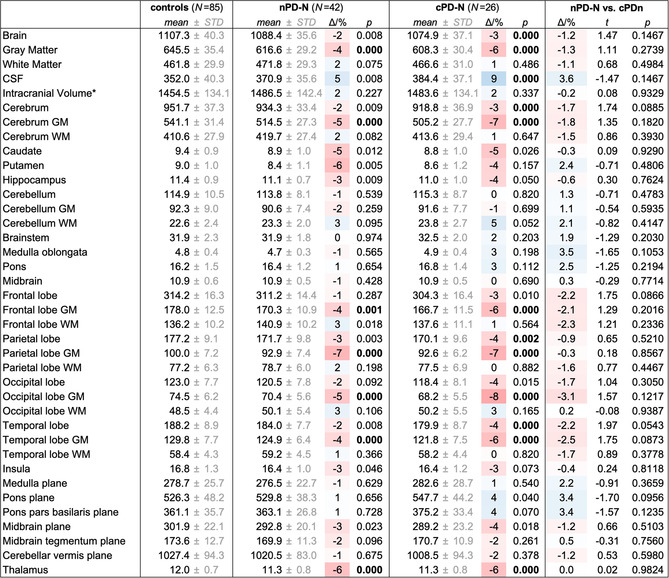
Table 5.
Volumetric results from atlas‐based volumetry (ABV) at study entry between “converters” and “nonconverters”

|
Note: Values are shown as volumes/cm3 and area/mm2 for planes. All values (*with the exception of the intracranial volume) are normalized to the study‐mean intracranial volume (1,459.3cm3) and adjusted to both the mean age (66.7 years) and mean years of education (14.3 years) of the whole study population at study entry. The given p‐values resulted from pair‐wise group comparisons between groups, that is, cognitively normal PD patients that maintain cognitive status throughout the study (“nonconverter,” nPD‐N), cognitively normal PD that converted (cPD‐N) to either MCI or dementia after 1.4 years on average, and healthy controls. Bold p‐values indicated statistical significance after Bonferroni correction for multiple testing. Deviation of means between groups are given as Δ/% = (V/V controls − 1) × 100% and overlaid on a three‐color scale from shades of red (volume loss) over white (no change) to shades of blue (e vacuo volume gain). CSF, cerebrospinal fluid; GM, gray matter; WM, white matter.
