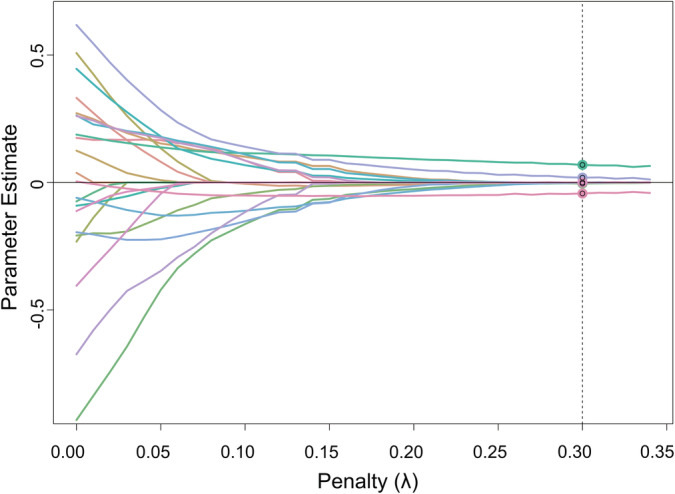
Figure 2.

Parameter trajectory plot from regularized MIMIC. The graph shows the values of the regression coefficients as a function of the penalty value. The dashed vertical line highlights the penalty value yielding the model with the best fit (i.e., the lowest Bayesian information criterion)
