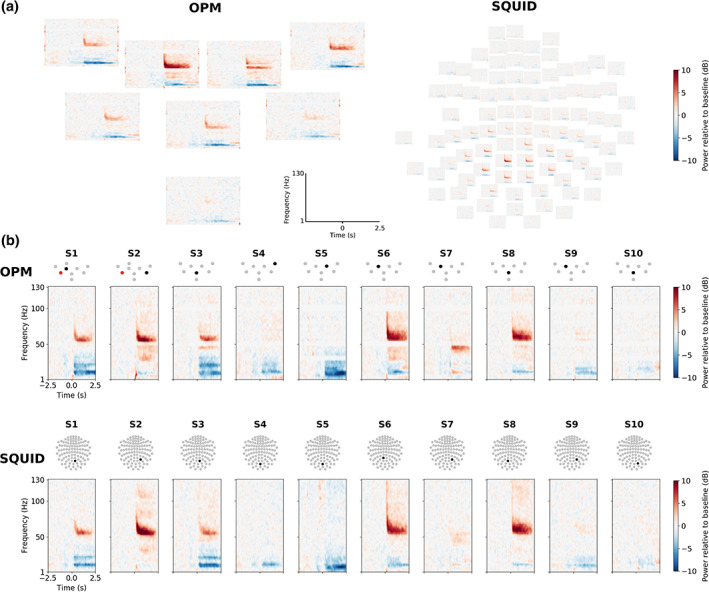
Figure 3.

Time–frequency representations (TFRs) of the induced responses. (a) Responses in a representative subject (Subject 6) in optically pumped magnetometer (OPM; left) and SQUID (right) magnetometers. (b) TFRs of the sensors with the maximal‐induced gamma‐band response for OPMs (top row) and SQUID magnetometers (bottom row) across all subjects (one column per subject). The topographic sensor layouts indicate the sensor of the TFR (black) and a malfunctioning sensor (red) not included in the analysis
