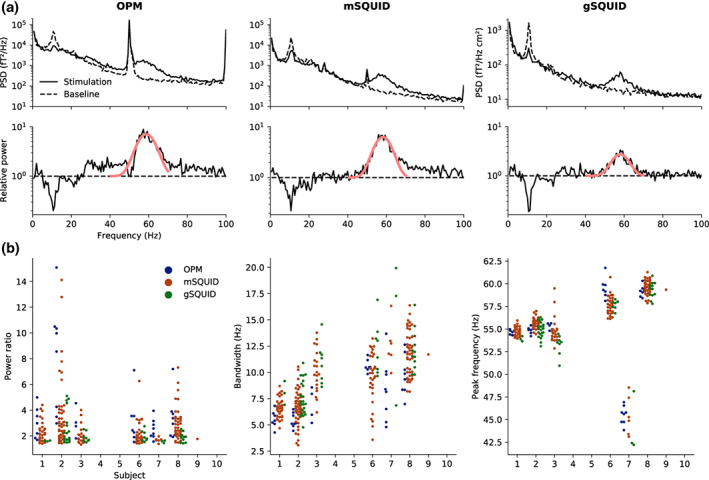
Figure 4.

Power spectral analysis. (a) Top: Power spectral densities (PSDs) estimated prior and during stimulation for the sensor with the highest gamma‐band power for optically pumped magnetometer (OPMs), SQUID magnetometers (mSQUID), and gradiometers (gSQUID) in a representative subject (Subject 6). Bottom: The ratio of the spectra (black) during stimulation and baseline, illustrating the power increase during stimulation, and the fitted Gaussian (red). (b) Relative power (stimulation vs. baseline), bandwidth, and peak frequency of the gamma response (extracted from the fitted Gaussian) across all subjects. The dots represent values for individual sensors
