
Figure 5.
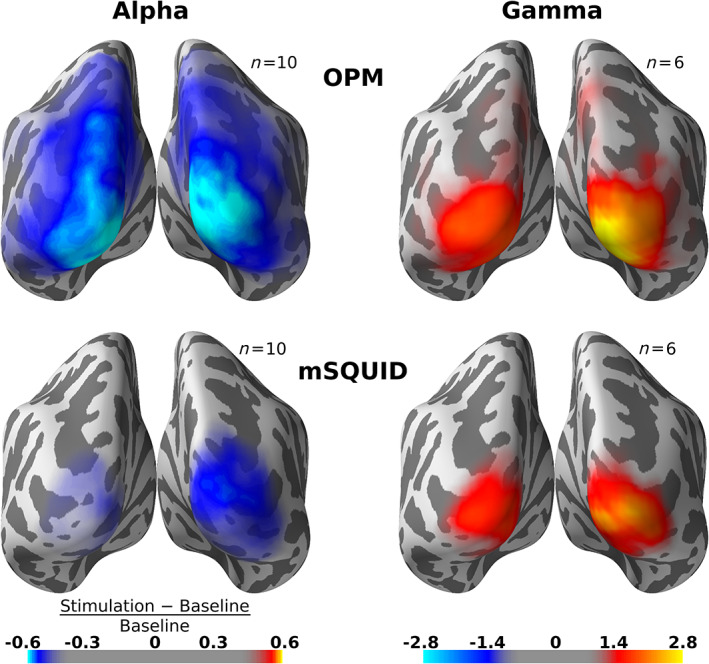
Grand‐average normalized source‐power difference between stimulation and baseline within alpha (7–13 Hz) and subject‐specific gamma bands for optically pumped magnetometer (OPM; top row) and SQUID magnetometers (mSQUID, bottom row). The difference is visualized on the FreeSurfer “fsaverage” template brain. Color maps are the same for both sensor types