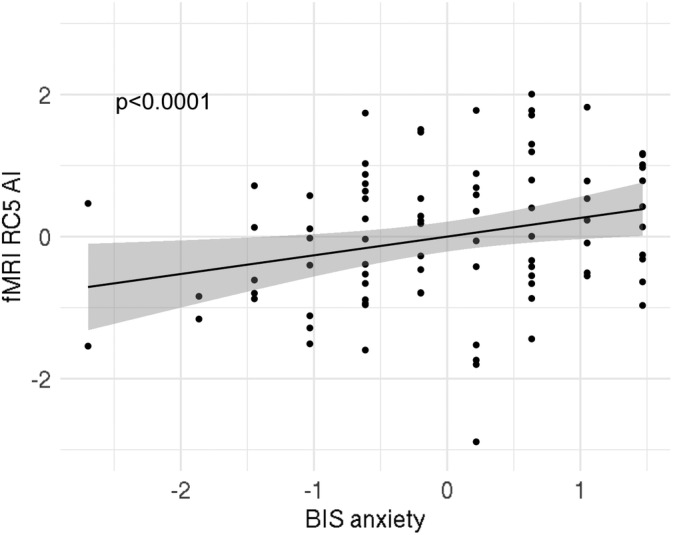
Figure 4.

Relationship between RC5 and BIS anxiety scores in Sample 2; there was a significant interaction effect of BIS anxiety scores on RC5. Index used: (L − R)/(L + R). Dots represent data points, line represents best fit and grey shaded areas are 95% confidence intervals. AI, asymmetry index; L, left; R, right; RC, rotated component
