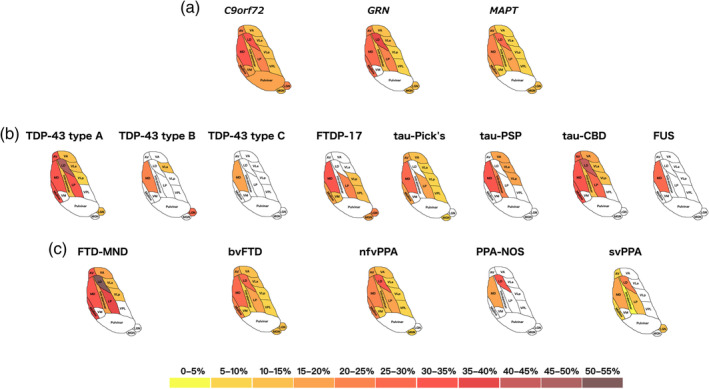
Figure 1.

Pattern of atrophy in the thalamic nuclei in the (a) genetic; (b) pathological; and (c) clinical FTD groups. The cartoon is a schematic representation of an axial view of the thalamic nuclei and is not anatomically accurate. Colour bar denotes the % difference in volume from controls
