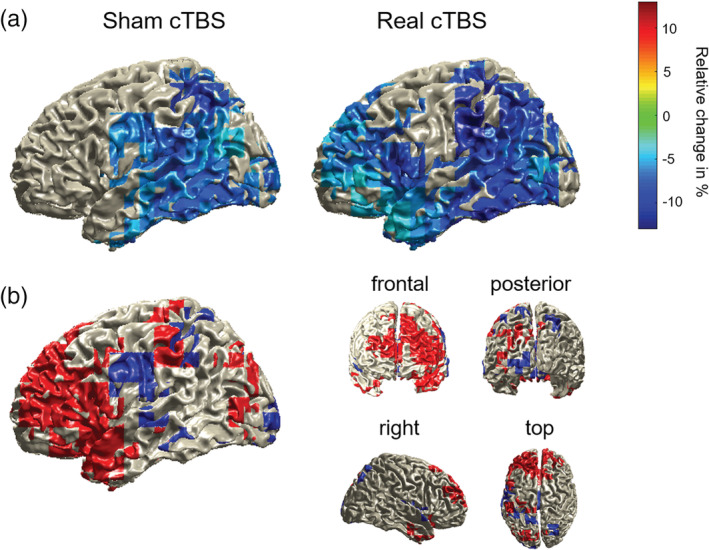
Figure 4.

(a) Source localization of the power decreases for constraining relative to nonconstraining contexts (displayed in relative percent change) for both cTBS conditions, masked by the statistically significant grid points. (b) Difference plot displaying suprathreshold source‐level activity specific for real cTBS (red) and sham cTBS (blue)
