
Figure 3.
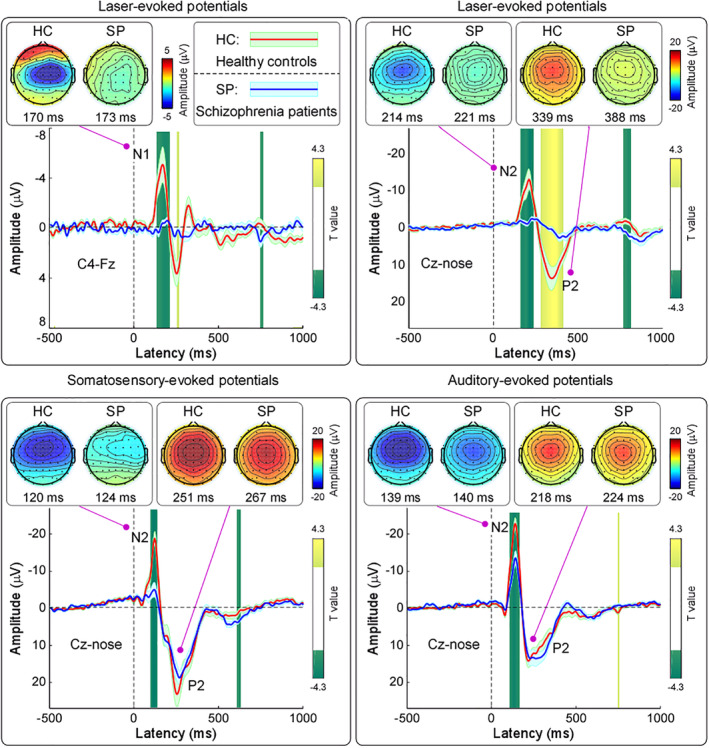
Group‐level event‐related EEG responses to sensory stimuli in the time domain. Top panels: Group‐level LEP waveforms and scalp topographies of N1 wave (C4‐Fz) and N2‐P2 complex (Cz‐nose). Data from SCZ and HC are displayed in blue and red, respectively. Time intervals with significant difference between the two groups are marked in green and yellow for negative and positive T values, respectively. Scalp topographies are plotted at the peak latency of each wave. Bottom left panel: Group‐level SEP waveforms and scalp topographies of N2 and P2 waves (Cz‐nose). Bottom right panel: Group‐level AEP waveforms and scalp topographies of N2 and P2 waves (Cz‐nose)