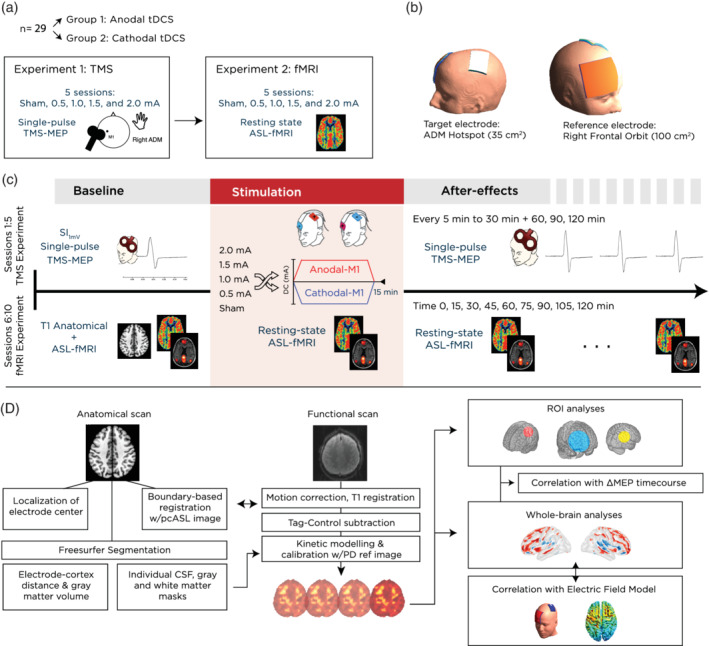
Figure 1.

Experimental design and methods. (a) The study involved 29 participants divided into two groups, who took part in two consecutive experiments: a TMS‐based cortical excitability study to investigate the effect of current intensity on cortical excitability, and an fMRI study to investigate identical stimulation parameters on cerebral blood flow and functional connectivity. (b) Prior to the scanning session, the motor‐cortical representation of the right abductor digiti minimi muscle (ADM) was located using single‐pulse TMS. The respective position on the scalp was used to place a 35 cm2 target electrode, rotated 45° to the midline, and with the cable exiting from the right posterior edge. A larger 100 cm2 return electrode was positioned over the contralateral right orbit, with the cable exiting from the participant's right hand side. (c) Scanning sessions started with acquisition of a high resolution, T1‐weighted FLASH anatomical scan, followed by the first block of two resting state scans, consisting of either BOLD (6 min) or ASL (5 min) acquisitions (note that the ordering was counter‐balanced across subjects). This block was repeated an additional nine times, beginning with the stimulation block, where tDCS was delivered for 15 min using either sham, 0.5, 1.0, 1.5, or 2.0 mA anodal or cathodal stimulation. Subsequent measurements took place every 15 min following the stimulation, for up to 120 min. (d) The analysis pipeline included a separate preparation of anatomical images for extraction of indivdual antomical parameters, such as gray matter volume and electrode cortex distance. Functional images were preprocessed and registered to the subject's high resolution anatomical image, and then to the MNI template before proceeding with statistical analysis. ASL, arterial spin labeling; blood‐oxygen‐level‐dependent; tDCS, transcranial direct current stimulation; TMS, transcranial magnetic stimulation
