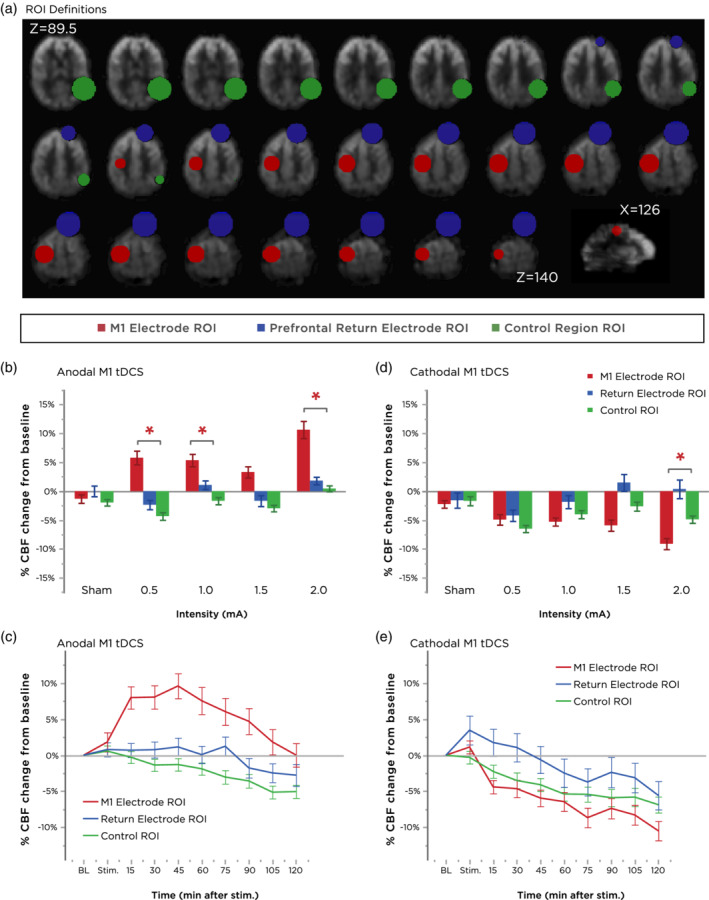
Figure 2.

Regional modulation of cerebral blood flow (CBF). (a) Axial slices extracted from a representative subject's mean perfusion‐weighted functional scan are labeled with definitions of the ROI masks used in the main analysis. Error bars represent the SEM. (b,c) Summary of the effects of different anodal M1 tDCS intensities (grand‐averaged over all timepoints in (b) and over all intensities in (c)) on each ROI. Note the selective effect of all intensities on CBF modulation in the target electrode/left hand M1 hand knob ROI, which persisted for the entire scanning duration. Error bars represent the SEM. (d,e) Summary of the effects of different cathodal M1 tDCS intensities (grand‐averaged over all timepoints in (d) and over all intensities in (e)) on each ROI. With the exception of 0.5 mA, the greatest decrease in CBF was again observed in the target electrode ROI. Cathodal‐M1 tDCS over all intensities induced a decrease in perfusion in the left M1 region, but a slight increase in perfusion in the right prefrontal region (location of the anodal electrode). Error bars represent the SEM. ROI, regions of interest; tDCS, transcranial direct current stimulation
