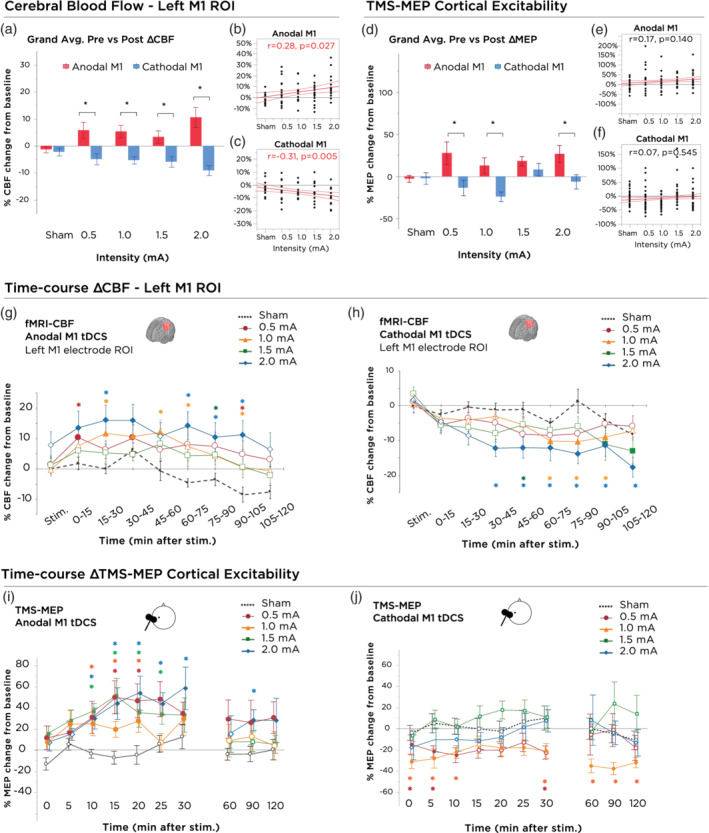
Figure 3.

Stimulation intensity and polarity dependent effects of tDCS on motor cortex excitability and local cerebral blood flow. (a) 0–120 min grand‐averaged after‐effects of cerebral blood flow following 15 min of anodal and cathodal stimulation at intensities ranging from sham‐2.0 mA within the target electrode ROI (left M1 hand knob region). Asterisks indicate significant differences between polarities (unpaired t‐test, p < .05). Polarity‐dependent differences were significant for all active tDCS intensities. Error bars indicate the SEM. (b) Correlation between current intensity and grand‐average change in CBF following anodal‐M1 tDCS. Red lines indicate the 95% CI. (c) Correlation between current intensity and grand‐average change in CBF following cathodal‐M1 tDCS. Red lines indicate the 95% CI. (d) 0–120 min grand‐averaged after‐effects of cortical excitability following 15 min of anodal and cathodal stimulation at intensities ranging from sham‐2.0 mA on the mean MEP amplitude. Asterisks indicate significant differences between polarities (unpaired t‐test, p < .05). Polarity differences were significant with current intensities of 0.5, 1.0, and 2.0 mA. Error bars indicate the SEM. (e) Correlation between current intensity and grand‐average change in motor cortex excitability following anodal‐M1 tDCS. Red lines indicate the 95% CI. (f) Correlation between current intensity and grand‐average change in motor cortex excitability following cathodal‐M1 tDCS. Red lines indicate the 95% CI. (g) Time‐course changes of CBF within the left M1 hand knob ROI following anodal M1 tDCS. 2.0 mA resulted in significantly elevated CBF, compared to sham, which persisted over the majority of the 2 hr session and peaked between 30–45 min after tDCS. Error bars indicate the SEM. (h) Time‐course changes of CBF within the left M1 hand knob ROI following cathodal M1 tDCS. 2.0 mA resulted in significantly decreased CBF, compared to sham as well as baseline, which lasted the entire 2 hr session. Delayed onset after‐effects were observed for the 1.0 mA intensity, between timepoints 60–105 min. Other intensities, although not significant, led to trendwise identically directed effects. Error bars indicate the SEM. (i) Time‐course changes in cortical excitability following anodal‐M1 tDCS. Filled symbols indicate a significant difference in cortical excitability against the “0” baseline (one‐sample t‐test, two‐tailed, p < .05). Floating symbols indicate a significant difference between the active intensity and sham stimulation (paired t‐test, two‐tailed, p < .05). Anodal stimulation over all active intensities resulted in significant increases of excitability lasting up to 30 min. Sham stimulation did not induce any significant change in cortical excitability. Error bars indicate the SEM. (j) After‐effects of cortical excitability following 15 min of cathodal stimulation at intensities ranging from sham‐2.0 mA on the mean MEP amplitude. Filled symbols indicate a significant difference in cortical excitability against the “0” baseline (one‐sample t‐test, two‐tailed, p < .05). Floating asterisks indicate a significant difference between the active intensity and sham stimulation (paired t‐test, two‐tailed, p < .05). Only 0.5 and 1.0 mA cathodal stimulation resulted in significant differences from baseline, and only 1.0 mA was significantly different from sham through the later time bins. Higher intensities such as 1.5 and 2.0 mA tended to return to baseline values after about 10 min. Sham stimulation did not induce any significant change in cortical excitability. Error bars indicate the SEM. MEP, motor evoked potential; ROI, regions of interest; tDCS, transcranial direct current stimulation
