
Figure 5.
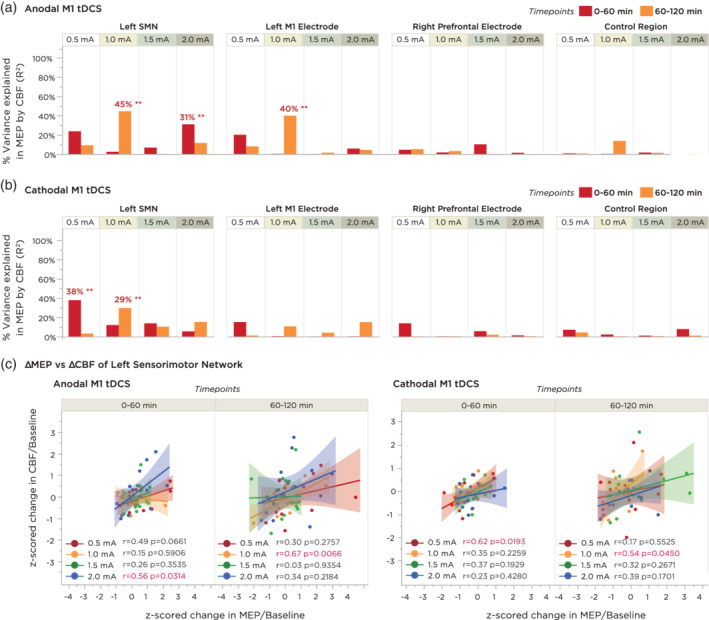
Correlation analyses between time‐binned averages in motor cortical excitability and cerebral blood flow. MEPs were compared to CBF values from four regions of interest: (I) the left sensorimotor network consisting of the somatosensory, primary and premotor cortices; (II) the anatomical region underneath the target electrode, corresponding to the left M1 hand knob area; (III) the anatomical region underneath the return electrode, corresponding to the right prefrontal area; and (IV) an ROI of the same size as the M1 ROI located over the right temporo‐occipital area. Correlations were calculated using linear/Pearson correlation between each subject's z‐normalized change in CBF versus their z‐normalized change in MEP, averaged across two 60‐min time bins. (a) Summary of percentage variance explained (R 2 value) for each of the above comparisons for anodal M1 tDCS. Double asterisks indicate a significant correlation (p < .05). (b) Summary of percentage variance explained for each of the above comparisons for cathodal M1 tDCS. Note that both anodal and cathodal M1 tDCS showed stronger associations between MEP and CBF changes within the Left SMN ROI. (c) Expanded plots of the correlation between change in CBF and MEP within the left SMN ROI for both anodal and cathodal M1 tDCS. Shaded background regions indicate the 95% CI. CBF, cerebral blood flow; MEP, motor evoked potential; ROI, regions of interest; tDCS, transcranial direct current stimulation