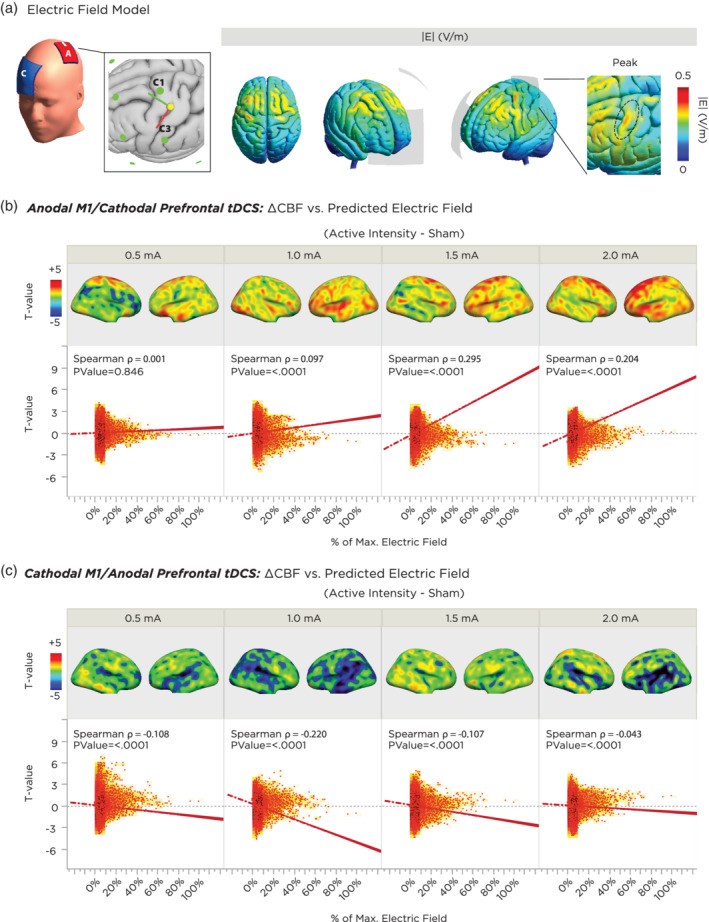
Figure 6.

Correlation between a realistic finite element model of the predicted changes in the electric field of cortical gray matter and actual physiological findings from the experiment. (a) Location of target and return electrodes on the MNI template head. The return electrode was positioned over position the “AF4” EEG position, and the M1 electrode was placed according to MNI‐standardized coordinates of the hand knob region. The resulting montage was segmented using the finite‐element‐method across anatomical tissue layers, and the electric field was computed, which showed a maximum peak underneath, and along the anterior edge of the target electrode. (b) Correlation between predicted electric field strength and tDCS‐induced CBF changes as a function of current intensity for anodal‐M1 tDCS. The top panels summarize the grand‐average T‐contrast between the active tDCS intensity vs sham, and the bottom panels indicate the respective voxel‐wise correlations between functional activation and predicted electric field. All intensities show a positive correlation (i.e., higher electric field predicted greater CBF increase relative to sham). Note that higher intensities of 1.5 and 2.0 mA showed a stronger association. (c) Correlation between predicted electric field strength and tDCS‐induced CBF changes as a function of current intensity for cathodal‐M1 tDCS. All intensities show a negative correlation (i.e., higher electric field predicted greater CBF decrease relative to sham). Note that the 1.0 mA intensity showed the strongest association. CBF, cerebral blood flow; tDCS, transcranial direct current stimulation
