
Figure 1.
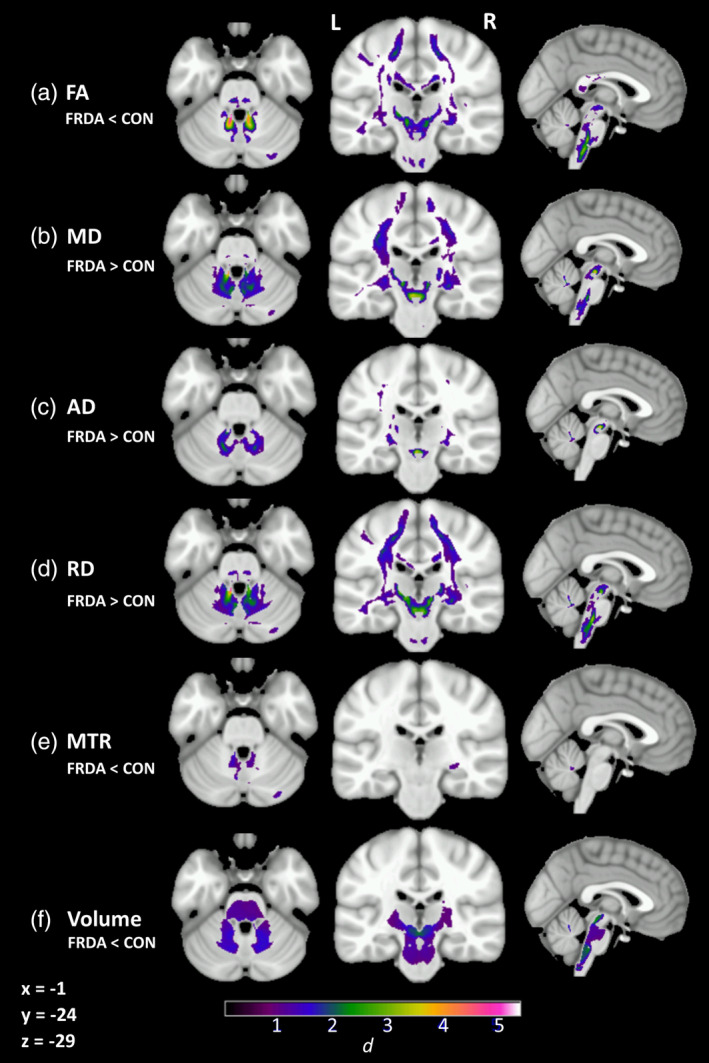
Significant group‐level differences between individuals with FRDA and controls (cluster‐level FWE‐corrected p < .05) in (a) fractional anisotropy (FA), (b) mean diffusivity (MD), (c) axial diffusivity (AD), (d) radial diffusivity (RD), and (e) magnetization transfer ratio (MTR) after accounting for (f) volume. Cohen's d indicated by color gradient