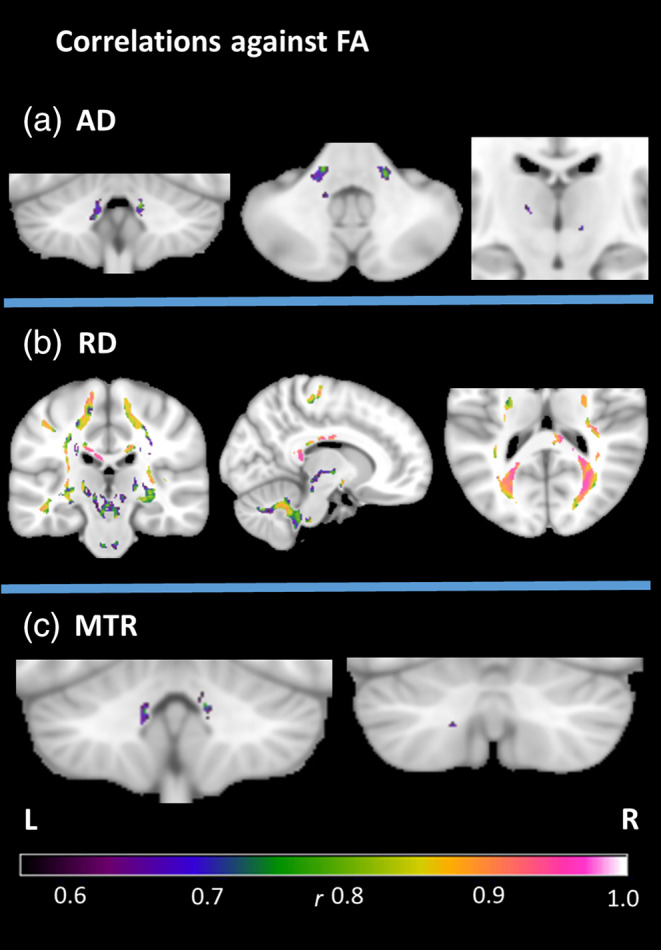
Figure 3.

Between‐metric correlations in the FRDA group at cluster‐level FWE‐corrected p < .05, with the mask defined by the intersection of significant group differences in FA and the named metric. Effect sizes (r) indicated by color gradient. AD, axial diffusivity; FA, fractional anisotropy; MTR, magnetization transfer ratio; RD, radial diffusivity
