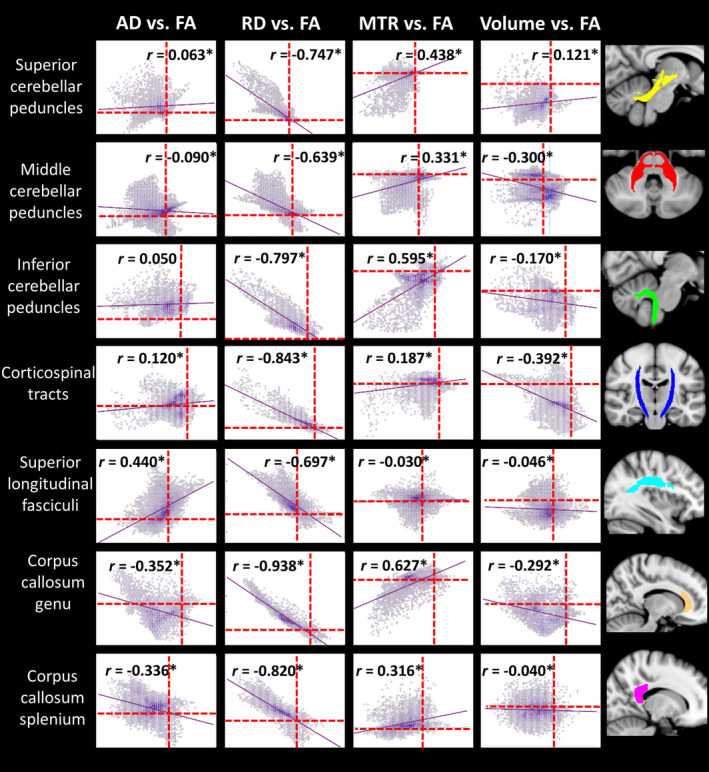
Figure 4.

Pearson correlations for between‐group differences in FA versus AD/RD/MTR/volume in each voxel within regions‐of‐interest. Dotted lines represent x = 0 and y = 0. FA is plotted on x‐axis, comparison indices on y‐axis. *Significant at corrected p < .05, accounting for 28 comparisons (i.e., p < .002). AD, axial diffusivity; FA, fractional anisotropy; MTR, magnetization transfer ratio; RD, radial diffusivity
