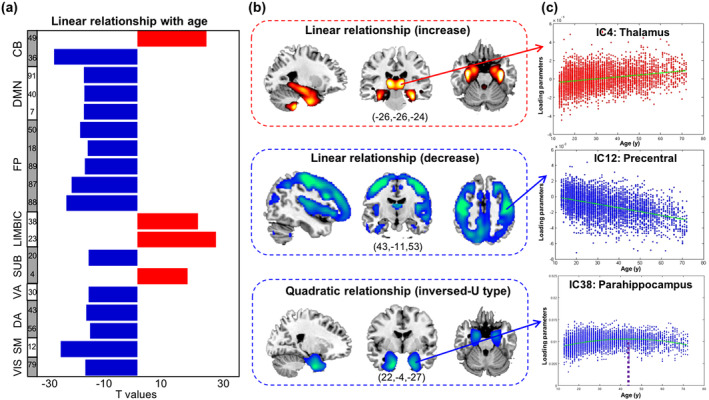
Figure 2.

The relationships between age and gray matter volume. (a) T values of the significant components. (b) Spatial maps of the significant components; three types of relationship were revealed. (c) Scatter plots of the representative components in each type. The blue color indicated negative T values for all relationships
