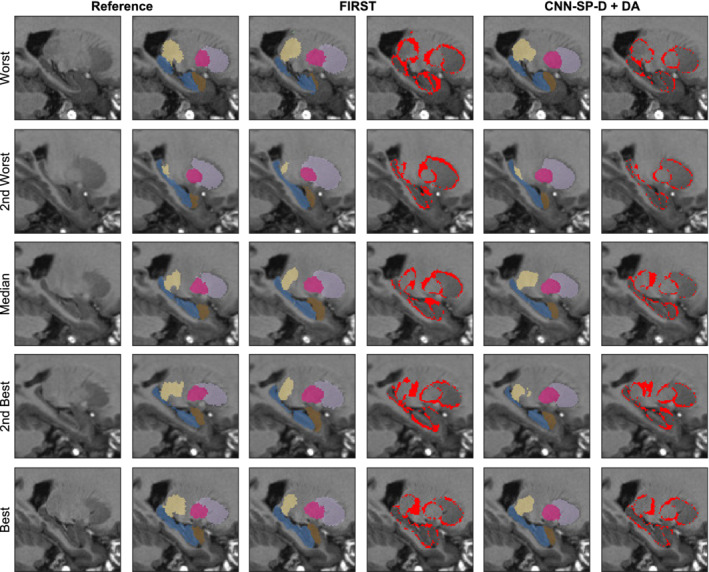
Figure 11.

Example multistructure segmentations and respective errors using FIRST and our best performing method CNN‐SP‐D + DA. The subjects with the worst, second worst, median, second best, and best overlap after applying FIRST are shown for comparison. The hippocampus is overlaid in blue, amygdala in brown, thalamus in yellow, putamen in pink, and caudate in light purple. Errors are overlaid in red in columns four and six [Color figure can be viewed at http://wileyonlinelibrary.com]
