
Figure 2.
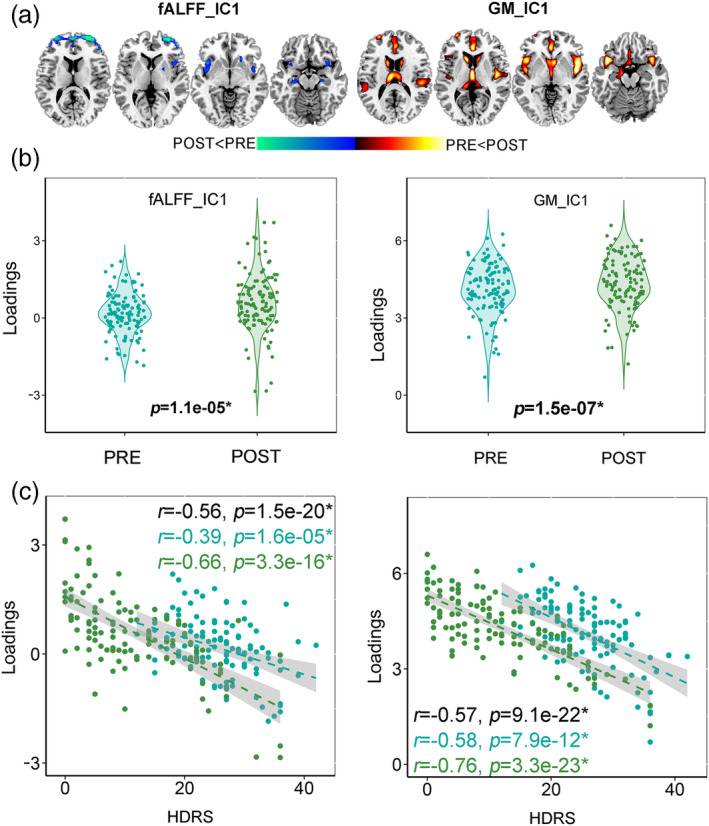
The identified joint components longitudinally discriminative between Pre‐ECT and Post‐ECT and correlated with the HDRS total scores for the entire DEP dataset. (a) The spatial maps visualized at |Z| > 2 thresholds, where the red regions identify the POST > PRE contrast and the blue regions identify the PRE > POST contrast. (b) Longitudinal difference between Pre‐ECT and Post‐ECT of the loading parameters (contribution weight of the corresponding component across subjects) of the target component. (c) Correlation between loadings of the identified components and HDRS (PRE: light green dots, POST: dark green dots). The black, light green and dark green values in each plot represent correlation of whole, Pre‐, and Post‐ECT datasets, respectively