
Figure 3.
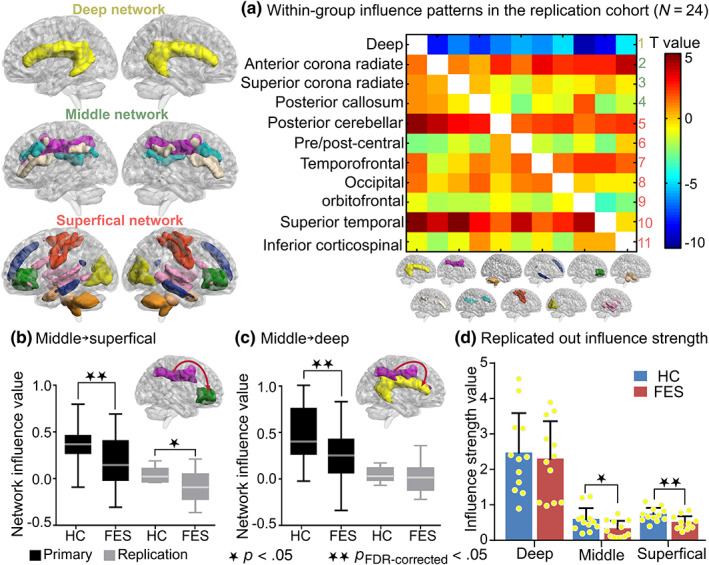
Replications of networks influence patterns and tri‐layer networks influence differences in an independent cohort (N = 24). (a) Within‐group influence patterns determined by one‐sample t tests across FESs and HCs. Positive and negative values represent excitatory influence and inhibitory influence, separately. (b) In the replication cohort, compared with HCs, the middle→superficial excitatory influence (t = −2.38, p = .03) showed significant decrease in FESs, which was similar with the primary cohort. (c) In the replication cohort, no significant decrease on the excitatory influence of middle→deep network (t = −0.65, p = .52) was observed in FESs compared to HCs. (d) The out strength of middle network influence was significantly reduced (t = −2.25, p = .03) in FESs compared to HCs. Additionally, the outflow influence of the superficial network was significantly decreased in FESs (t = −2.94, p = .008). ★ denotes p < .05. ★★ denotes p FDR‐corrected < .05. FES, antipsychotic‐naive first‐episode schizophrenia patient; HC, healthy control