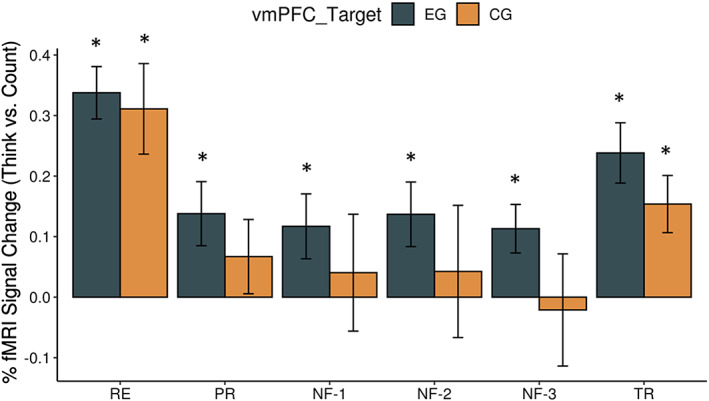
Figure 2.

Percent fMRI BOLD signal change for the target ROI. The mean percent signal change for the Think–Count conditions for each experimental run: Practice (PR), Neurofeedback‐1 (NF‐1), Neurofeedback‐2 (NF‐2), and Neurofeedback‐3 (NF‐3) in the BOLD signal for targeted ventromedial prefrontal cortex (vmPFC: −2, 39, and –4). The error bars represent the SE of the mean. Supplementary Table 1 includes the mean BOLD signal changes and statistic results for RE, PR, NF‐1, NF2, NF‐3, and TR runs and both the subject groups. The asterisks show statistically significant difference from zero [Color figure can be viewed at http://wileyonlinelibrary.com]
