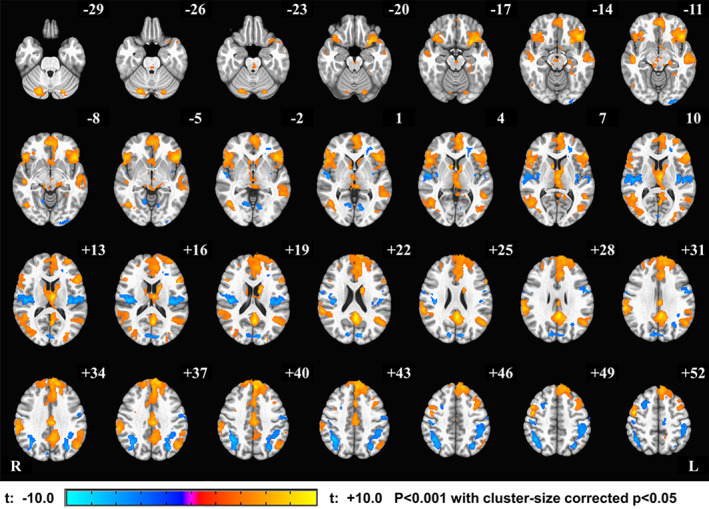
Figure 3.

Activation Network for Think–Count condition within the experimental group (EG). The group fMRI activation analysis for the Think–Count contrast revealed significant positive BOLD signal changes in the DMN including vmPFC, precuneus, and right inferior parietal lobule, while the significant negative activations in insula and parietal lobe (see Supplementary Table 2 for clusters peak coordinates). The activation maps are projected on the MNI152 standard‐space T1‐weighted average structural template. The right side (R) of the brain is shown on the left, and the left side (L) is shown on the right [Color figure can be viewed at http://wileyonlinelibrary.com]
