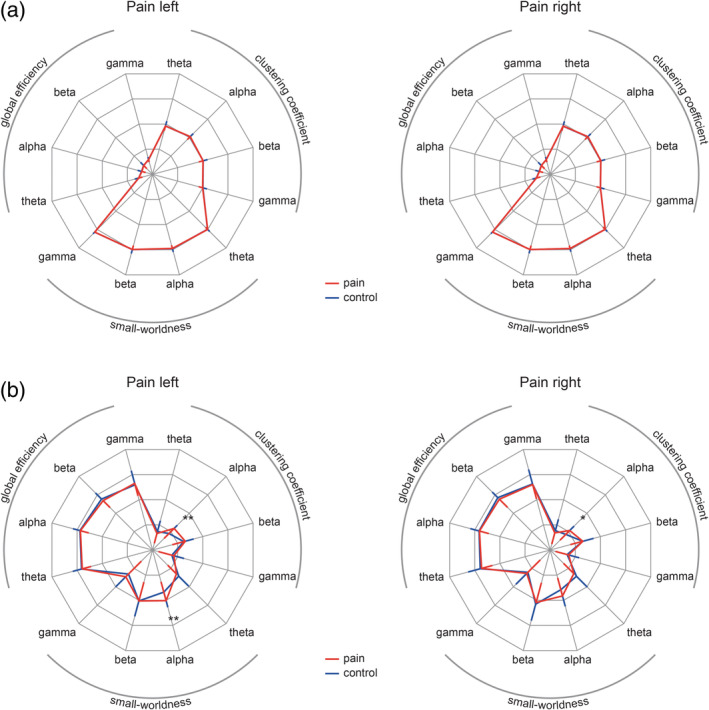
Figure 4.

Global measures of functional connectivity. Radar charts depict global graph measures clustering coefficient, global efficiency, and small‐worldness (S) for all conditions and frequency bands. Red lines indicate pain conditions and blue lines indicate control conditions. Error bars represent the SD for the pain conditions (red, inward oriented) and control conditions (blue, outward oriented). (a) PLV‐based global graph measures are shown with a scale ranging from 0.4 (center point) to 0.8 in steps of 0.1. For visualization purposes, small‐worldness was scaled by a factor of 1/7. None of the PLV‐based graph measures differed significantly between pain and control conditions for any of the investigated frequency bands. (b) dwPLI‐based global graph measures are shown with a scale ranging from 0.2 (center point) to 0.6 in steps of 0.1. For visualization purposes, small‐worldness was scaled by a factor of 1/7. The global clustering coefficient in the alpha band was significantly increased in both pain conditions. Furthermore, small‐worldness was increased in the pain left condition. *p < .05, **p < .01. dwPLI, debiased weighted phase lag index; PLV, phase locking value
