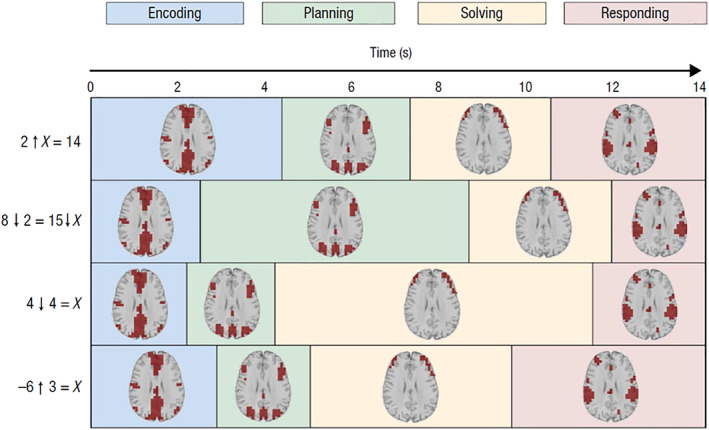
Figure 1.

An illustration of the state sojourn times for four trials where different problems were solved. The four problems are given to the left where the arrows denote new mathematical operators that students had learned. Each problem has different cognitive demands, and all happened to take 14 s to solve. In each state, the axial slice (z = 28 mm at x = 0, y = 0 in Talairach space) highlights brain regions whose activation in that state is significantly greater than the average activation during the entire problem. Note brain images are displayed in radiological convention with left brain on the right Source: Anderson et al. (2015)
