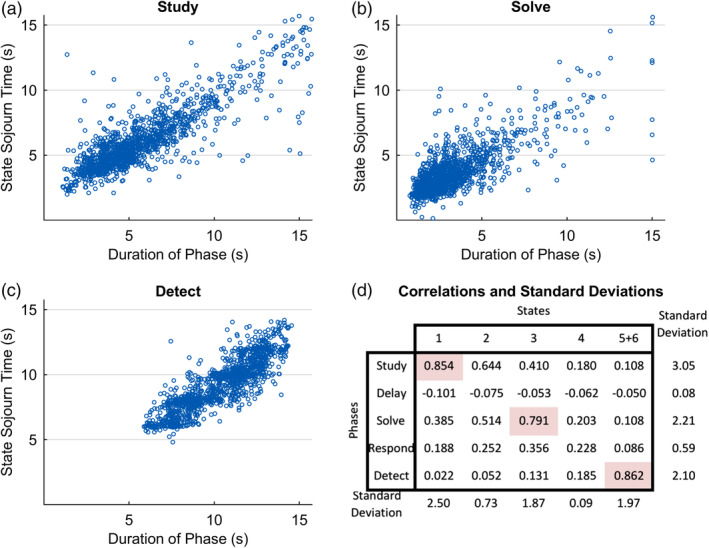
Figure 8.

(a)–(c) Correspondence between true behavioral phase durations on a trial and estimates from the State 1 Separate 6‐state model. Best fitting linear equations: (a) Y = −0.62 + 1.04X; (b) Y = −0.17 + 0.94X; (c) Y = 1.82 + 0.92X; (d) correlation between all phase durations and sojourn time estimates
