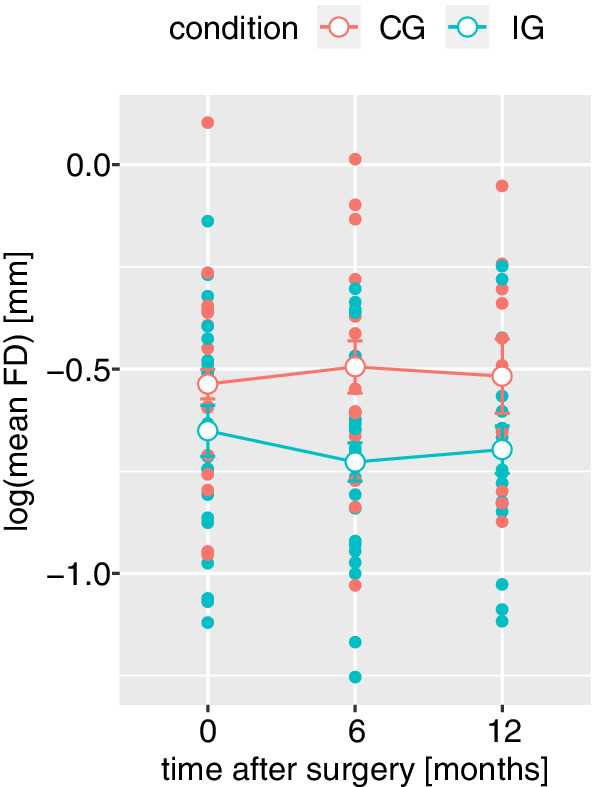
Figure 1.

Head motion during resting state fMRI, measured as log‐normalized mean framewise displacement (mean FD), decreases in the intervention (IG) compared to the control group (CG), shown in blue/red, respectively. Open dots represent group and time point averages, error bars represent within‐subject errors
