
Figure 2.
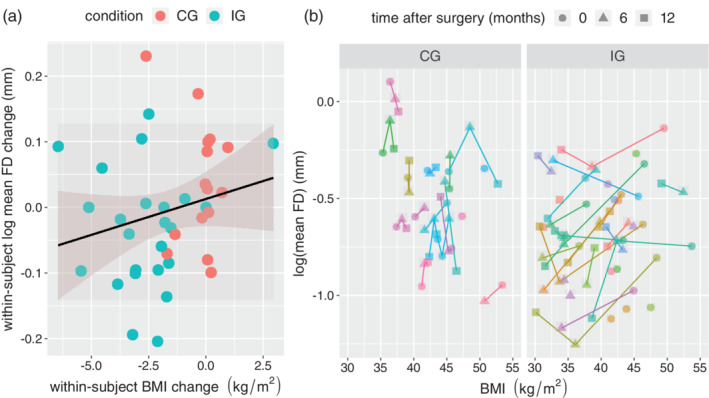
(a) The within‐subject change in BMI (x‐axis) from baseline to 6 month follow up predicts the change in mean FD (y‐axis). Color represents the condition (red: control group (CG), blue: intervention group (IG)). The line shows the regression curve with 95% confidence intervals. (b) Detailed BMI and mean FD trajectories for CG (left) and IG (right). Each color represents one participant. Time after surgery is symbolized by a circle (0 months), triangle (6 months) and square (12 months). BMI, body mass index; FD, framewise displacement