
Figure 5.
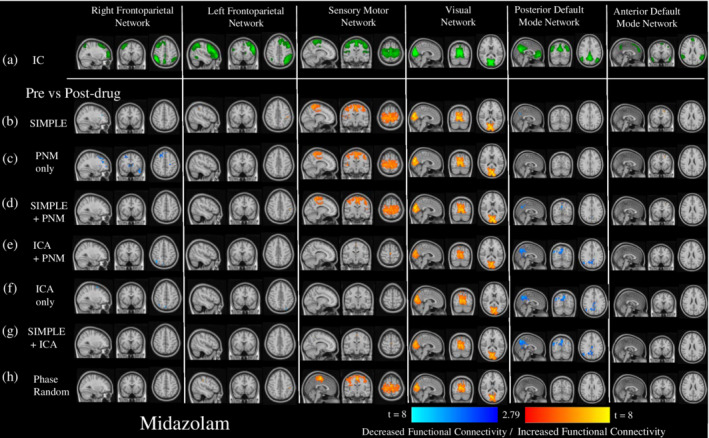
The impact of different preprocessing pipelines on the pharmacological modulation of six common resting‐state networks by midazolam. This figure depicts the changes in connectivity from baseline of six RSNs derived from independent components (depicted in green, Row a.)) after the administration of midazolam, for different preprocessing pipelines. Shown are t‐value maps from a dual regression between pre‐ and post‐drug, with increases in connectivity depicted in red‐yellow, and decreases in dark‐light blue, masked by areas that demonstrated significant change from a randomized paired‐t test, with a Bonferroni‐corrected threshold of p < .05. This was done after seven different preprocessing pipelines: (b) CSF and WM regressors only, (c) PNM regressors only, (d) CSF, WM, and PNM regressors, (e) ICA‐derived and PNM regressors, (f) ICA derived regressors only, (g) CSF, WM, and ICA‐derived regressors, (h) CSF, WM, and the same number of regressors as in the most extensive pipeline (ICA + PNM), but phase‐randomized to ensure they are true noise