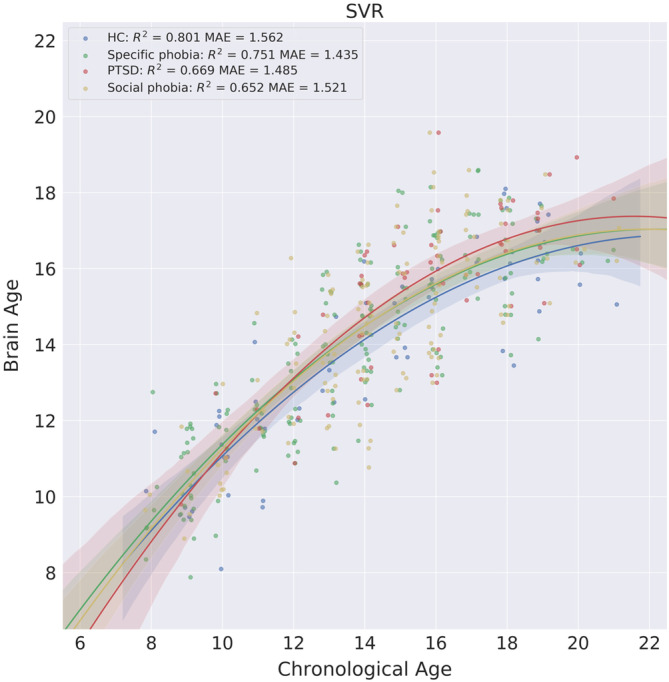
Figure 5.

Scatterplots of the brain age and chronological age for the HC and anxiety disorder groups. The shaded area along the regression curve indicates the 95% bootstrapped confidence interval

Scatterplots of the brain age and chronological age for the HC and anxiety disorder groups. The shaded area along the regression curve indicates the 95% bootstrapped confidence interval