
Figure 3.
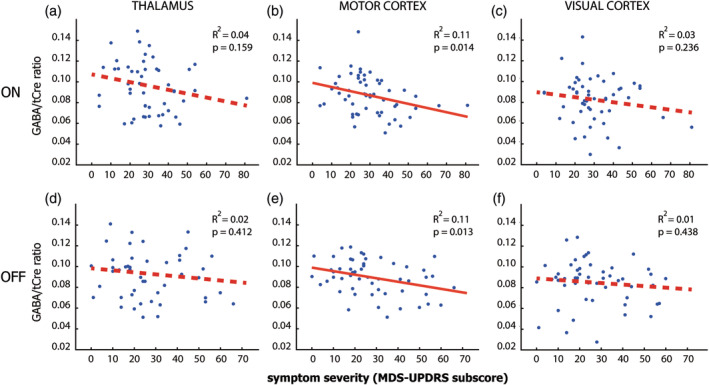
Relationship between GABA and disease severity. Scatterplots of the relation between GABA/tCre and total MDS‐UPDRS scores across the three Parkinson phenotypes, both ON medication (Panels a, c, and e) and OFF medication (Panels b, d, and f) for each of the three regions (first, second, and third columns). Significant correlations are marked with a continuous red line. We find a consistent significant correlation between MDS‐UPDRS scores and GABA levels in the motor cortex, both ON (Panel c) and OFF medication (Panel d), but no significant correlations for the thalamus (Panels a and b) and visual cortex (Panels e and f). GABA, gamma‐aminobutyric acid; MDS‐UPDRS, Movement Disorders Society Unified Parkinson's Disease Rating Scale; tCre, total creatine